
Edible Mushrooms - Classifier Comparison
What are the most important features that distinguish edible mushrooms from the poisonous ones? Can classifers that perfectly divide a dataset be our safe guide in the field? Here’s a story on data analysis meeting practical needs, with human error taken into account. Tools applided include Sklearn, AWS, postgreSQL, D3, Flask.
Mushroom foraging
“All mushrooms are edible. But some you can eat only once.” - The Brazilian wisdom (quotes from my colleage Natalia Bernardo)
I moved to the Pacific northwest about a year ago and absolutely enjoy the nature here. My husband Matthew has a couple of relatives who are very experienced mushroom foragers. With their encouragement, we joined the Puget Sound Mycological Society and started to identify and collect mushrooms during our hikes. It’s mostly for fun so far, although I hope some tasty ones will show up on our dinner table one day. We have a pocket-size guide book which we like a lot, the famous “All that the rain promises and more” by David Arora, but we haven’t formed the habit to bring it with us on every short or long hike. When I saw the gilled mushroom dataset in the UCI machine learning repository, I started to wonder, is there a quick screening method that tells whether a mushroom is likely edible or not?
The UCI gilled mushroom dataset
The UCI mushroom dataset is available from UCI Machine Learning Repository and also from Kaggle. The dataset includes 8124 gilled mushrooms, labeled as either “edible” or “poisonous”. Note that the poisonous class also include mushrooms of unknown edibility or not recommended to eat. There are 22 attributes, mostly of appearance such as color, shape, etc., but there are also ones that require close examination, such as the smell, whether it bruises or not when broken, the color of the spore print, etc. The information in this dataset was originally extracted from the book “National Audubon Society Field Guide to North American Mushrooms”. After a quick browsing through a few species in the book, I realized that the 22 attributes are only a subset of the atttibutes information provided in the book - perhaps something to keep in mind for future work.
EDA: perfect dataset?
Out of the 8124 mushrooms in the dataset, 4208 are labeled edible and 3916 poisonous, roughly half and half. The two classes are well balanced and no up-sampling, down-sampling, or class weight adjustment is necessary as a start.
Each of the 22 attributes contains multiple categories. For example, “cap color” can be red, orange, white, green, purple, etc. In order for Sklearn classifiers to work, these multiple categories are converted to one-hot dummy variables. The 22 attributes expanded to 117 features with binary values such as “cap_color_red” (1-yes or 0-no). The target is also binary: whether the mushroom is poisonous or not.
A quick EDA was done using 70% of the dataset as training set and the remaining 30% as testing set. To my surprise, almost all the classifiers I tested gave 100% accuracy. Take the decision tree for example: 7 questions got them all. Isn’t it nice?
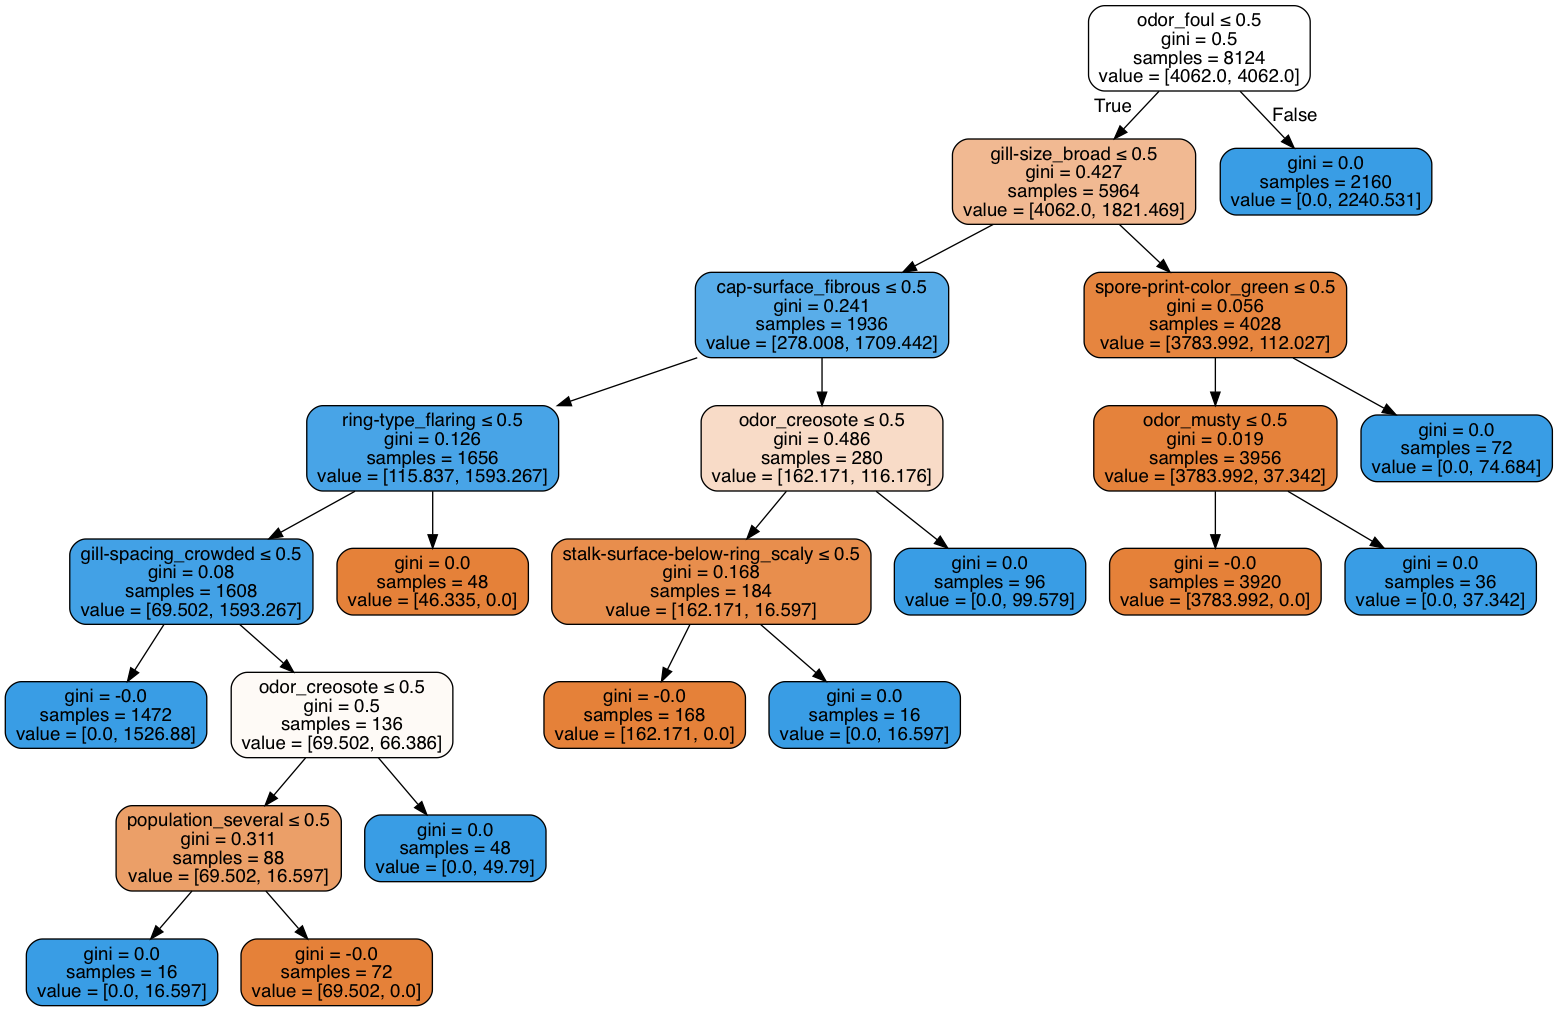
This is almost too good to be true, I thought. Take a closer look into the important questions that leadto a potentially “life-death” choice, you’ll see why I was concerned.
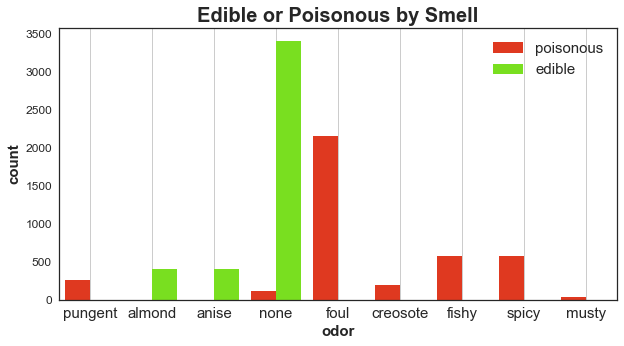
- Concern #1: how well can you smell? It turns out that the smells of the mushroom are the most discriminating features between being edible and poisonous:
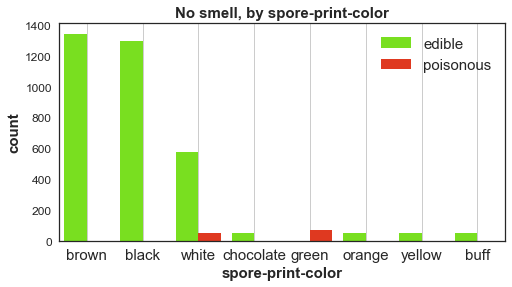
- Concern #2: is spore print available? Spore print color is the next important feature. However, obtaining good spore print in the field by an amateur is difficult and unreliable.
-
Concern #3: aren’t both “chocolate” and “cinnamon” brown? Some of the colors are difficult to tell from each other.
-
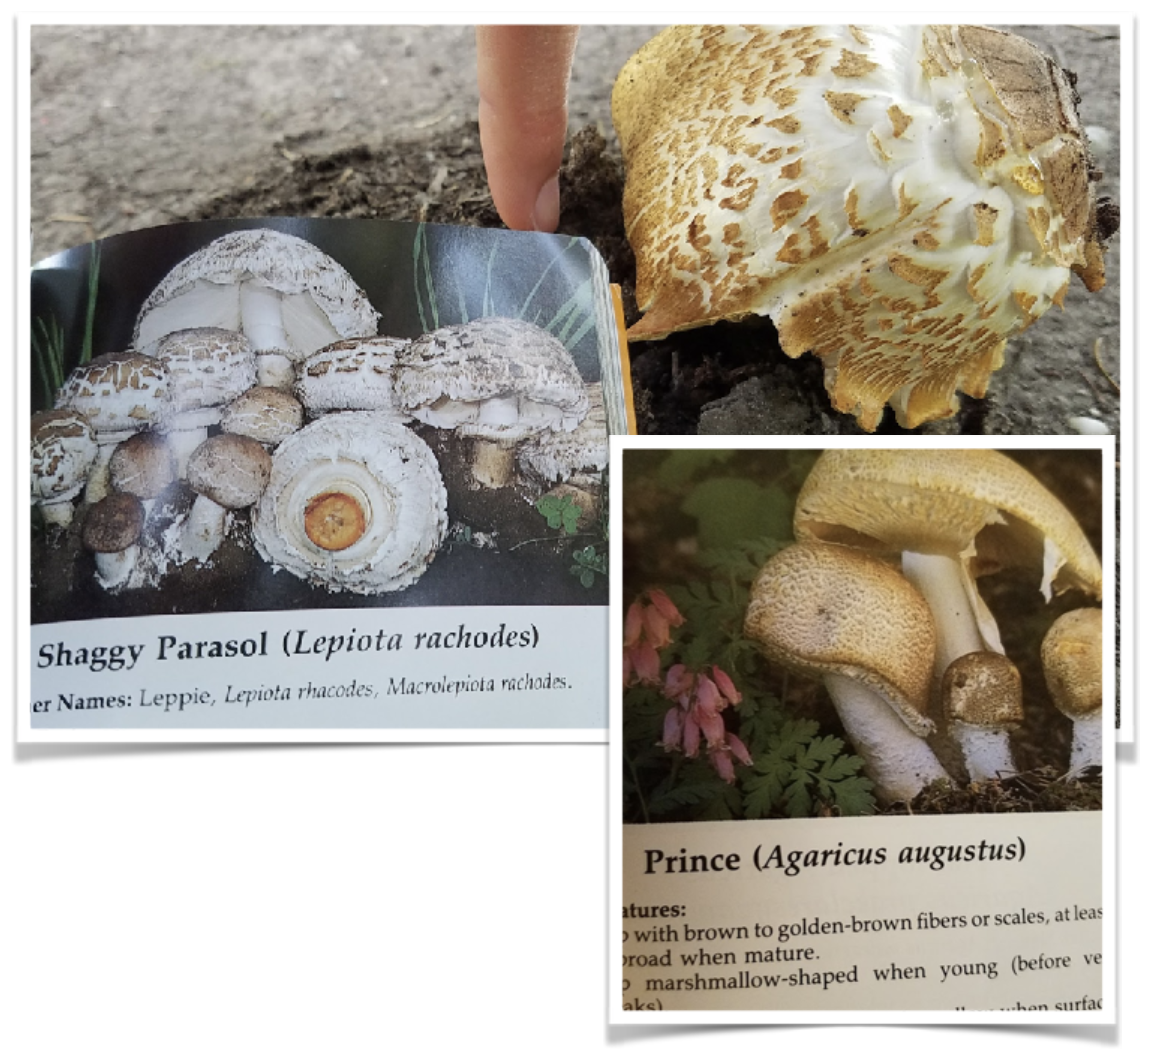
Concern #4: the shape, color, smell, and texture of a mushroom changes throughout its life cycle. Also environmental conditions can significantly alter the appearance. For example, the mushroom we found on the Sammamish river trail, which we thought was a shaggy parasol, turned out to be more likely a very delicious “prince”. The dry summer last year made the cap look shaggy and the body dehydrated and lacking yellow stain, although the sweet almond fragrance was very pronounced.
Practical feature selection
Drop/Merge ambiguous features: out of the 117 features, the ones that are too difficult to tell apart are merged. For example, the colors “chocolate” and “cinnamon” are merged with “brown”, and surface texture “silky” is merged with “smooth”. Other features that are too ambiguous to make judgement are dropped, such as terms describing population including “several” and “numerous”, etc.

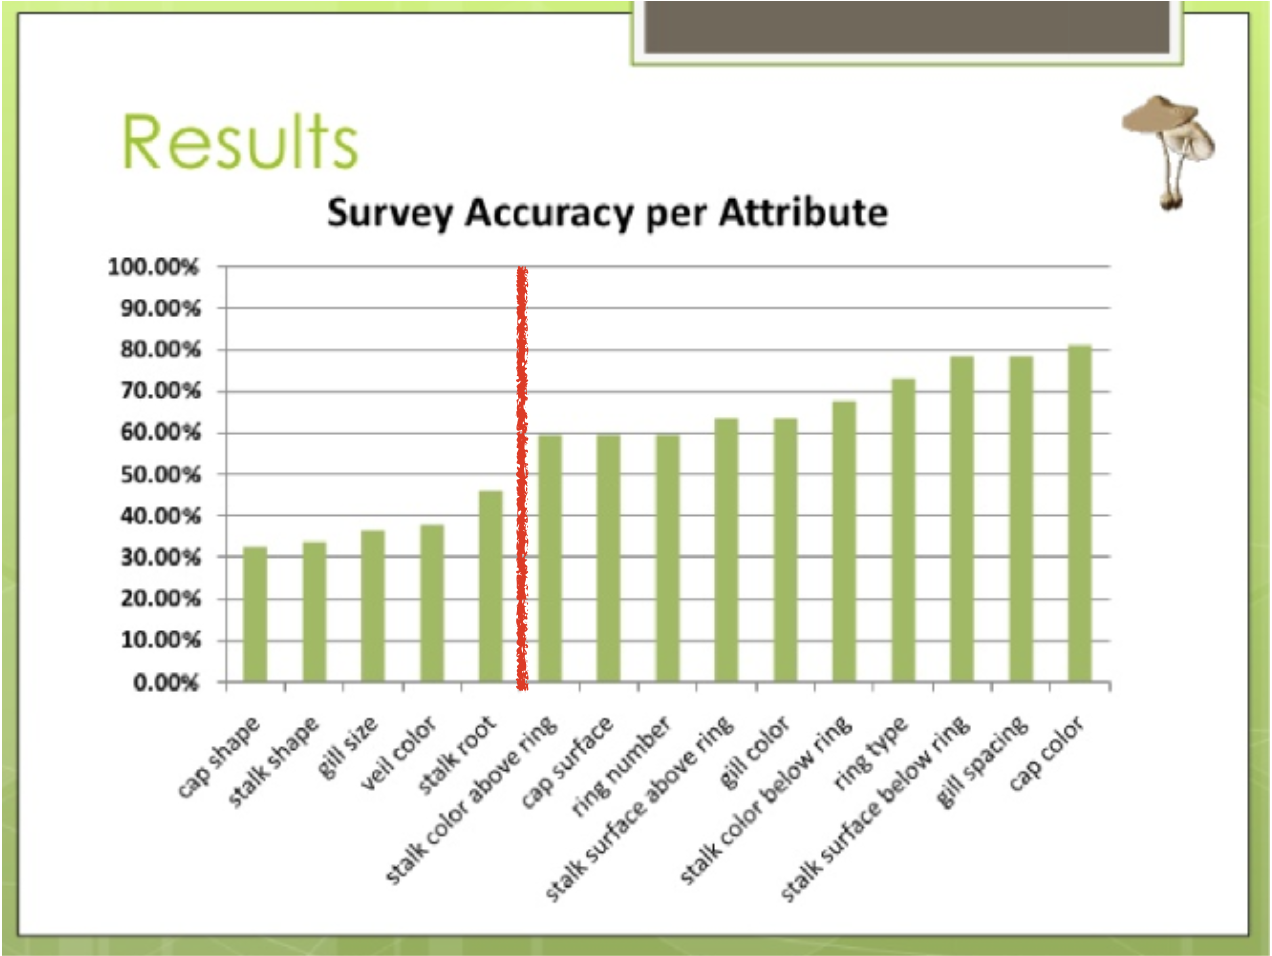
Account for human perception: while researching for this project, I came across an interesting survey on the same mushroom dataset: each participant was asked some questions about the appearance of three selected mushrooms, and the accuracy of their answeres were evaluated. Surprisingly, “cap shape” has an accuracy of barely 30%, among the lowest and much lower than what I have expected. Features of highest accuracy (~80%) are things like cap color, stalk surface texture, and gill spacing. Based on this survey, I discarded features with <50% accuracy in my dataset.
Classifier comparison
After the above two feature selection processes, the total number of features was brought down from 117 to 61.
Eventually, the classifier of choice need to predict whether a mushroom in the field is likely edible or not, which means human perception error should be taken into account. To incorporate human erorrs in the confidence of prediction, I added some random noise to the test set by switching the binary feature values to the opposite value (0 to 1, or 1 to 0). At first this “noise” is only applied to 1% of the training set, then 10%, and 20%. As the model was still trained on the clean training set (with selected features), it was expected that performance on the test set was gradually reduced with increased corruption in the test data.
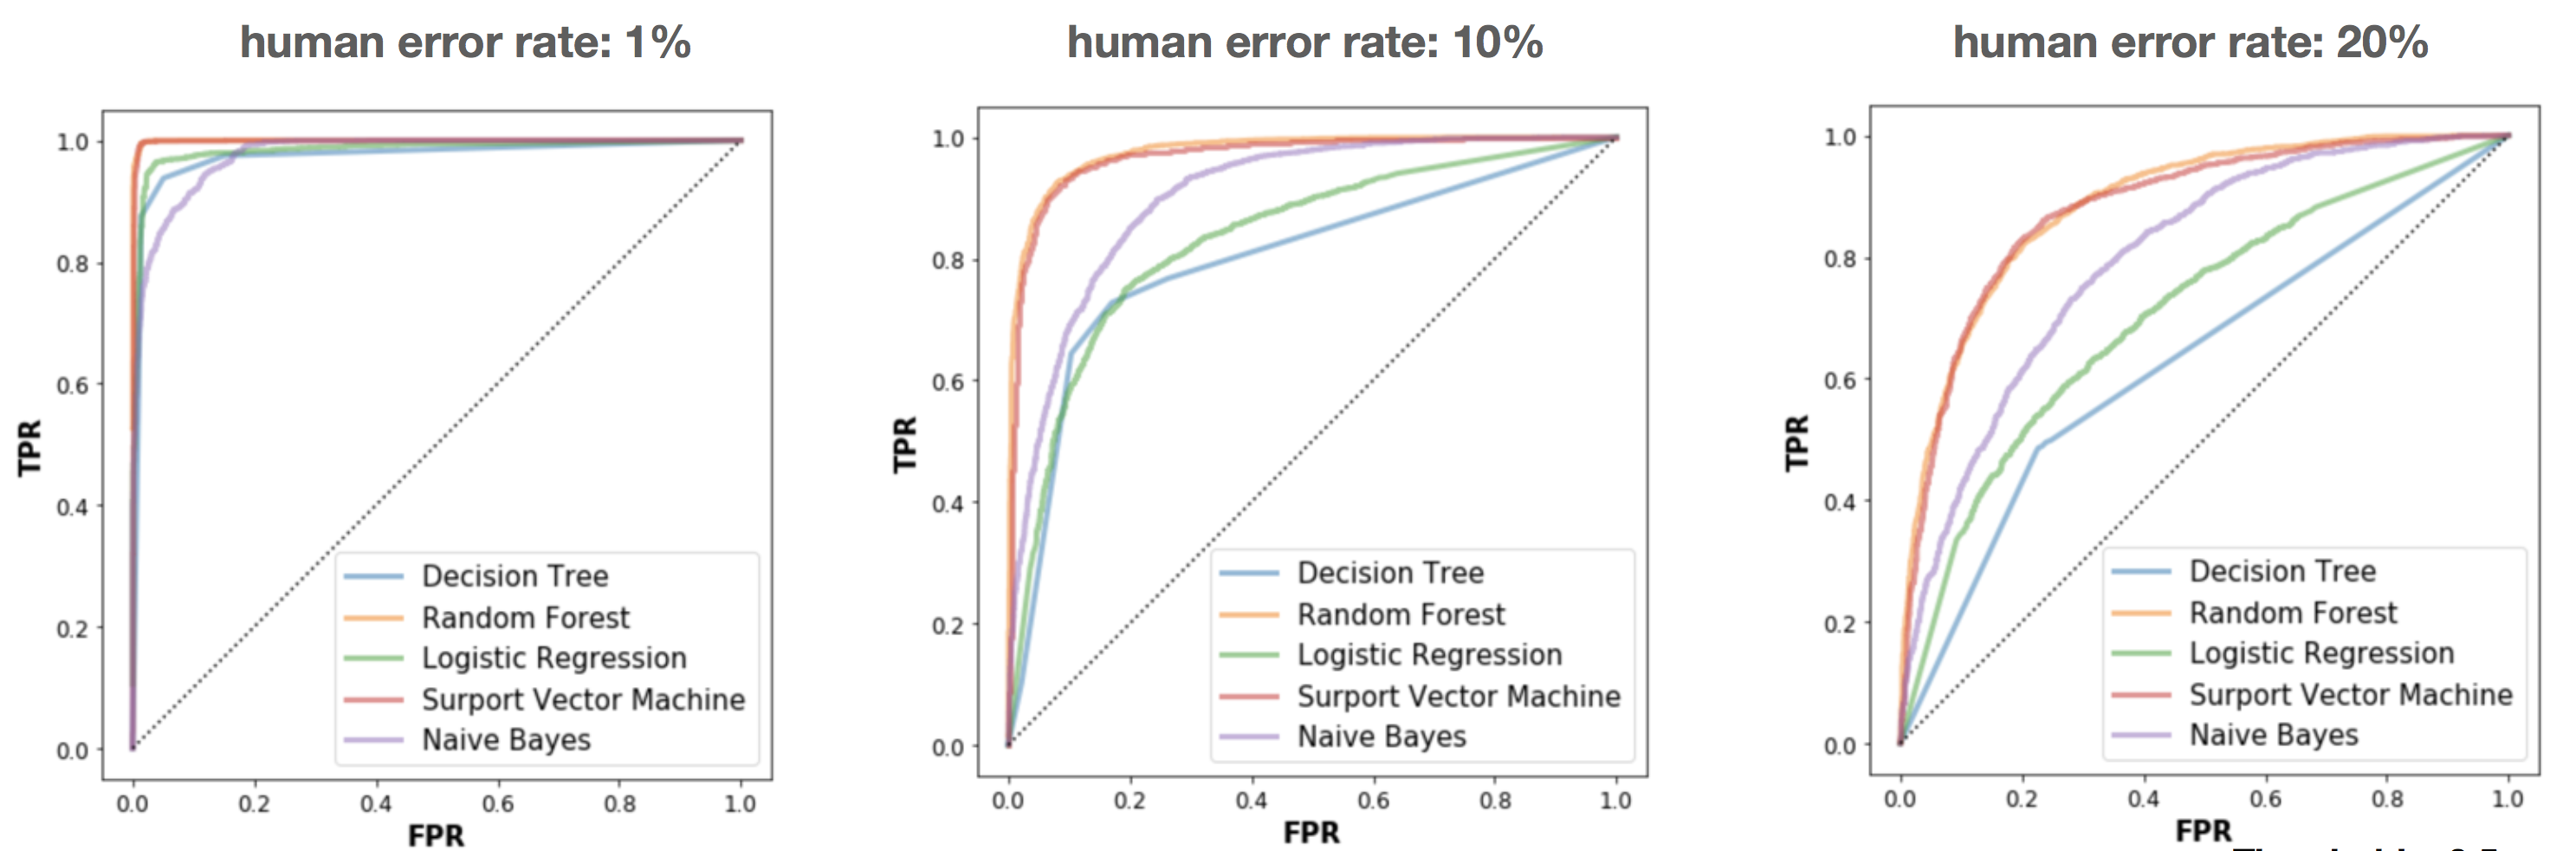
Now the better classifiers really shine.
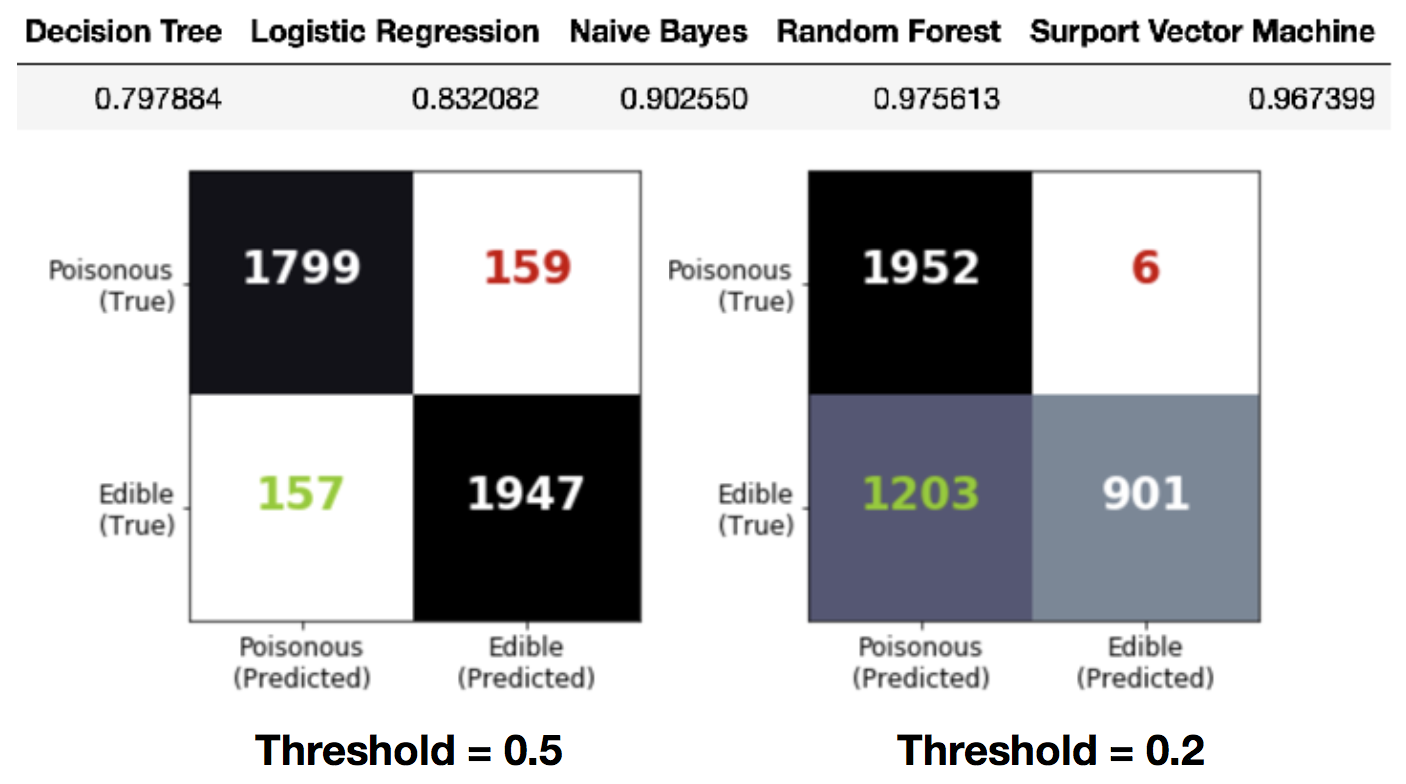
The confusion matrix show the performance for each class. For application, the prediction threshold should be set to a smaller value, to ensure a small false negative rate, which is the amount of poisonous mushrooms identified as edible. This will ramp up the false positive rate, edible mushrooms misclassified as poisonous. However, it is of much less severity to miss a tasty dinner than to risk your life.
Ideas for new mushroom app
The last part of this project is prototype mushroom app. Mushroom identification Apps already exist in the market, and there are two types of identification method:
-
Image-based: this type of apps ask user to take a photo with their phone and the algorithm is based on image-recognition.
-
Dictionary: this type of apps ask user to browse through a list of characteristics to narrow down to a shortlist of mushroom species.
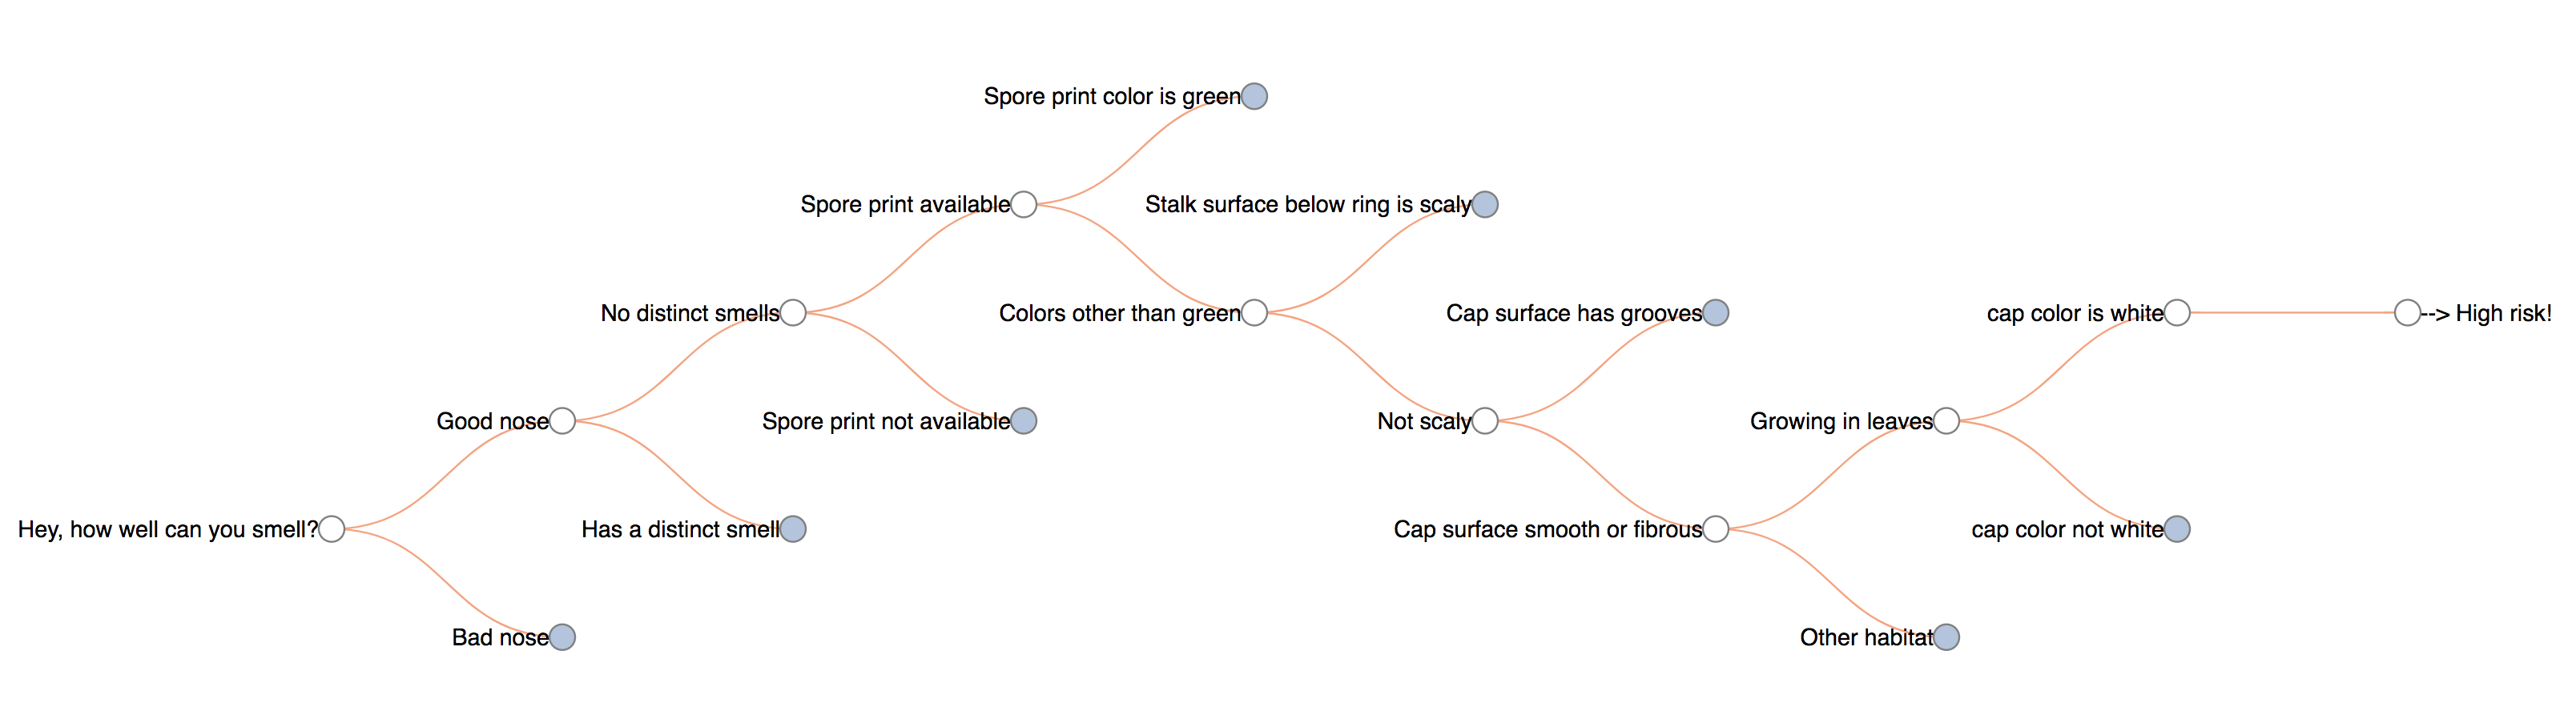
For the prototype of our data-based app, the philosophy is that a set of simple questions can provide a quick screening to help user decide whether it is high risk or low risk. If low risk, collect some samples and take home for further verification! For example, the “Death Cap” will go through a route like this and arrive at a “High Risk!” conclusion.
To build a fully functioning app, below are a few future additions to consider:
- Combine GPS location and time/season info to take advantage of geographical and temporal information
- Extra validation with image recognition
- Include encyclopedia information on mushroom species
- Ask user to provide feedback if the collected mushroom is identified after collection