
Metis Project 1 - First Week & Pandas
It has been a short and productive week. For our first project, we dove right into Pandas and provided recommendations for an NGO in New York City using MTA turnstile data and more.
First Week at Metis
The first Monday of our cohort was MLK day, which meant that we had to cover more content each day, and we also had only thee days to finish the first project. Living in Redmond, I spend on average 2.5 hours per day commuting to Seattle downtown by bus. For the first week, I slept less than 6 hours per day but remained surprisingly productive, despite the lack of sleep. I guess there was a bit of adrenaline rush too.
The outcome? It turned out to be an intense week, productivity-wise. To be honest, at the end of the week I felt exhaused and I’m a little disappointed about how the project turned out. However, this “learning feast” has been quite satisfying. Each day consists of paired programming, lectures, and project work. As I disvoered, the paired programing and lectures laid a necessary foundation for the tools and design thinking to be applied in the project, but are only meant to be a starting point. The core of the learning happens when you try to apply what you’ve learned. Sites such as stackoverflow helped, but there were plenty of times when I got lost. Thankfully, our instructors and teaching assistants would offer immediate help. For someone who’s normally comfortable with self-learning, this made a big difference.
The diversity of the colleagues is amazing. People bring in experience from fields like math, economics, earth sciences, astronomy, and programming. I appreciate the social aspects of the bootcamp. This has been a great change from working remotely for months.
Project Benson
For the first week is a group project, and I had the honor to form a team with Alando and Natalia. A request was sent from a (fictional) client in NYC, WomenTechWomenYes(WTWY). They have an annual gala at the beginning of the summer, both for publicity of women in technology and for fundraising for their cause. The question: could we provide professional opinions on the placement of their street teams at subway stations, to obtain sign-ups from people that are most likely to attend the gala, and even better, to donate money?
The suggested dataset is the MTA turnstile data, which is freely available. After some discussion, the team also selected two additional datasets to add to our analysis: demographics such as women population and income level, and the locations of tech companies in NYC. In an ideal world, we were good to go and it felt like once we combine all these, magic would happen. The reality? It was quite a journey through obstacles, and we could not have learned in a better way.
Dealing with the Dirty and and the Messy
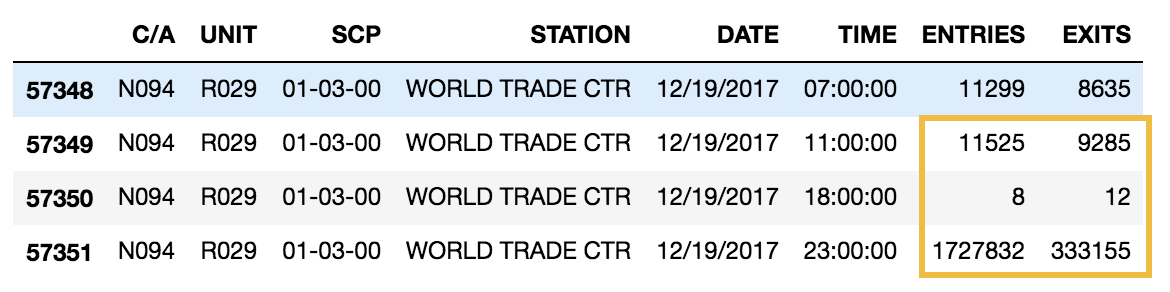
Understanding the data: it took some efforts to figure out the meaning of the columns of the MTA data. Each unique combination of the first 4 columns corresponses to one turnstile in the whole NYC subway system. Once that was figured out, data organized by turnstiles for each station was just one “groupby” away in pandas.
Watching for Outliers: at individual turnstile level, it was not difficult to tell the entry/exit recording was cumulative. One would assume that the numbers simply goes up monotonically - it did, mostly. Quick plots showed big outliers: sometimes it was a big drop (the recorder was reset), or a big jump (perhaps surges as some of these happen across several turnstiles at the same station). (Un)luckily, the outliers threw off the mean by magnitudes, which also made it straightforward to detect and remove them. Below is an example of the “reset” and “surge” behaviors all happened at once:
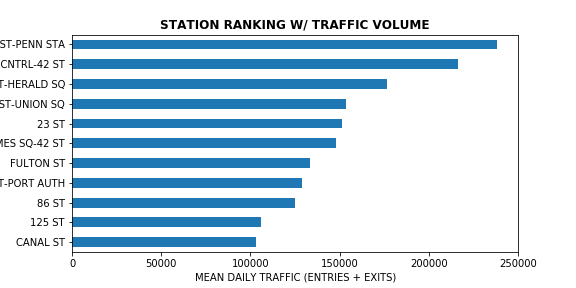
Data Merging Relay Race: at this point we had ranked the stations by mean daily traffic volume for the year of 2017. NYC census data was available in a clean format on Kaggle. But merging the two took the longest time in our data preparation, in three steps:
- Cooridinates of the stations were in a separate csv file than the MTA turnstile data. And… stations were named differently in two files. Option 1: find another coordinates file with the same names. Option 2: figure out the naming mapping between the two. Our team went for Option 2, and Alando solved it with “FuzzyWuzzy” package. Stations were located.
- Census data were only given by census tract code. To find the corresponding census tract for each station, a “locater” has to work. Alando tried mapping to Zip code but were stopped by glitches in Google API. Without knowing better approaches, I wrote a function as a backup plan, which maps each station to their closest census tract based on centroid, which worked well for most stations, but not perfect. In the end, Natalia found a method to send online request to locate (lat,long) point to census tract directly. The relay race is finally completed. Teamwork is the best.
Simplification: Not much time left when we got to the point of locating tech company information. A quick search did not return usable compiled location dataset. I found some summarized information from builtinnyc.
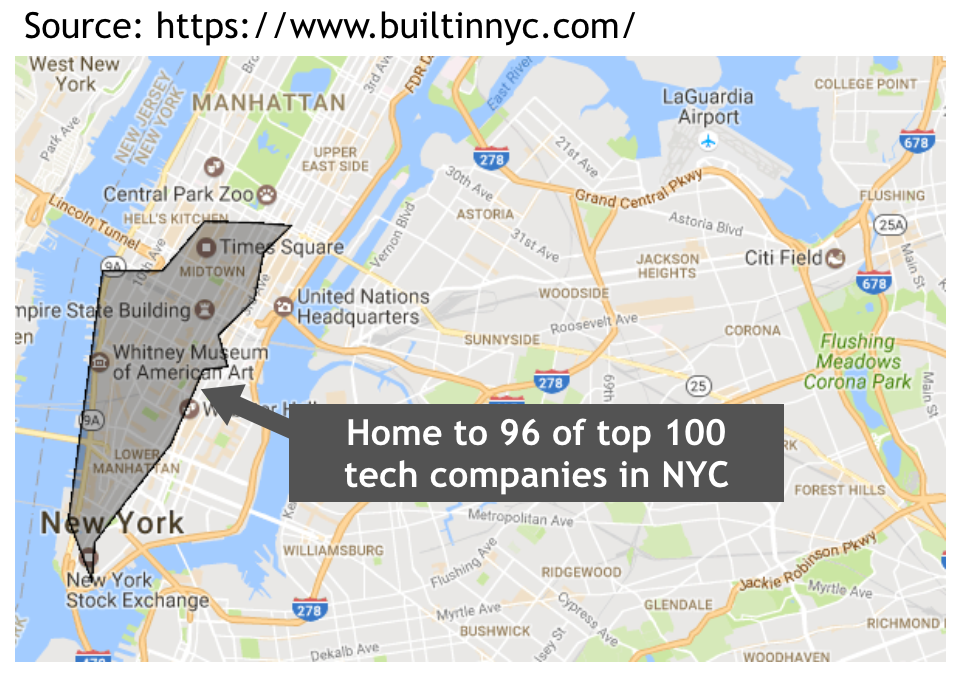
A quick sketch in Google Map generated the boundaries of the “Tech Hot Zone”. From there the last column in our MTA data was created, an indicator of whether a station is in Tech zone or not. If we had more time, I can see this being done in a prettier and more accurate way. But one thing I learned in the journey was to set your priorities wisely.
The Recommendation for WTWS
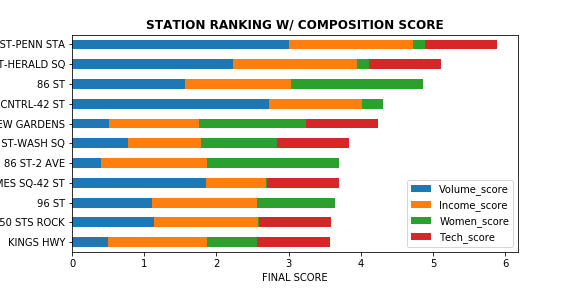
The subway stations were ranked using a weighted scoring system that accounted for “daily volume”, “women population”, “median income” and “In Tech Zone”. Each variable was normalized using Min-Max method. As a starting point, the weights were set to a ratio of 3:2:2:1 for the four factors, respectively. We would like to tweek these parameters further with the client as the next step. Below is a plot showing the score composition for the top stations - you can see how the additional factors change the ranking of the stations in comparison to traffic volume alone:
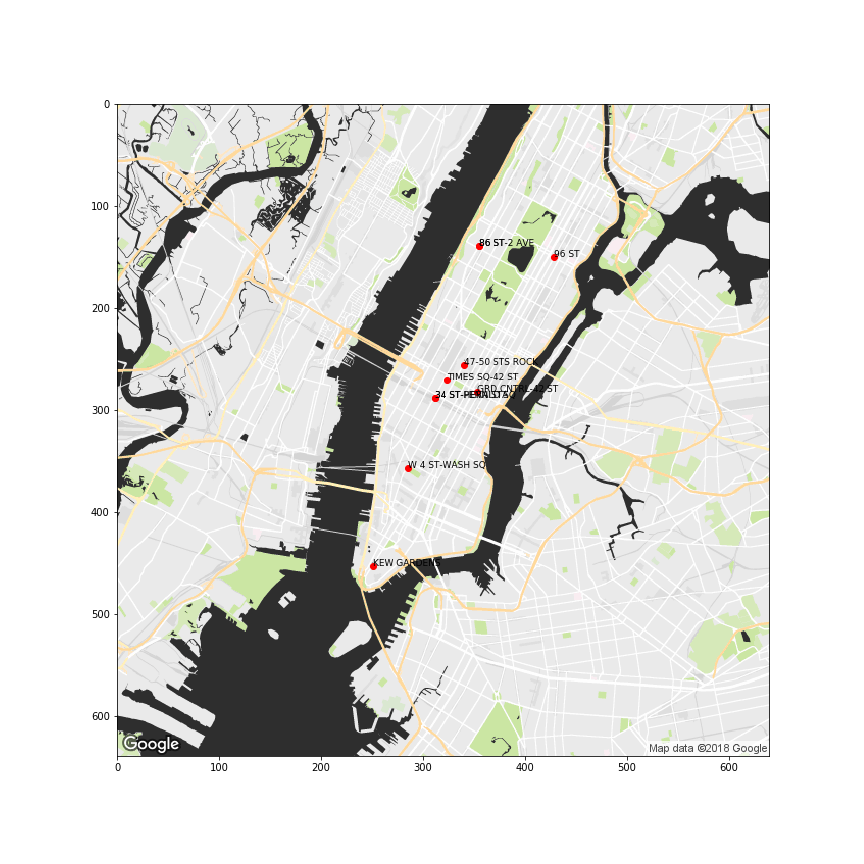
Unfortunately, we didn’t have enough time to finalize the visualizaiton of the recommended stations on a city map. In a future post I’ll dig further into geographical visualization. Anyways, here’s a simple visualization of the top 10 (11) stations using maps generated through Google Map static map API. Note that “34 ST - HERALD” and “34 ST - PENN” are essentially at the same location, therefore the 11th in the rank is also added.
The Presentation
One thing I regret about Project Benson, is not giving enough time to prepare and actually practice the presentation. Our TA offered several times to go over the slides with us, but we were racing against time to get our data in a better shape, without realizing on a practical level that there was always more data and better model, but they mean nothing if you cannot communicate them well. By the way, we also remembered the starting time wrong, which was a careless mistake that significantly cost our performance.
As I said earlier, I’m disappointed that the presentation went worse than we expected. But hey, that’s one of the reasons we came to the bootcamp. We got constructive feedbacks from the instructors and TAs, such as how to tailor to specific audience and body languages. Another important takeaway was, as watching other teams presenting, I also learned that a coherent story, even though relatively naive, was better than a fancy, but broken one. Good visualization always deserves a fair amount of time and efforts.
Final Thoughts
Remember in the movie “Matrix”, Neo asked Trinity whether she could operate a helicopter, and she said “Not yet” because she know she was going to learn it in a few seconds? Well, it feels a bit like that in the bootcamp. And things you thought you knew, there might be a better way. Chances are, whatever knowledge gap you have, you will be able to figure it out, or at least a feasible direction, with your “support group” that consists of the instructors, the TAs, and the rest of the class. It’s wonderful.